
HAV Group
A bet on operational leverage - Micro Caps in 10 minutes #11

Good morning, Micro Investors!
Welcome to a new edition of Micro Caps in 10 minutes. If you are not yet subscribed, you can join the best newsletter for independent investors who are not afraid to invest in the most unknown companies in the market.
Investment Thesis
HAV Group ASA (HAV) is a marine engineering company that provides design and integration of complete vessel systems, electric propulsion systems, and water treatment systems. Following its separation from the Norwegian shipyard Havyard group through a spin-off, HAV is listed on the stock market with a MC of NOK 300 million and an EV of 250 million.
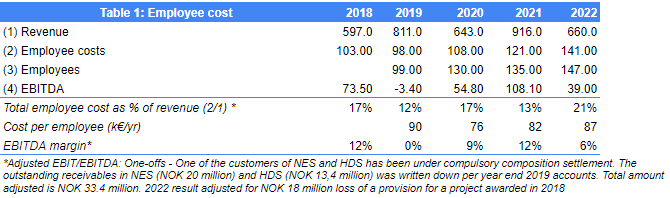
The investment thesis for HAV focuses on operational leverage. The company has gross margins of around 35%, but it has increased its fixed costs to expand its capacity and develop new products. However, sales have been volatile, causing NOPAT to drop from NOK 70 million in '21 to 3 million in '22, while sales decreased from NOK 900 million to 620 million. This volatility is common in cyclical companies, but HAV has diversified its sales in recent years, which should improve revenue stability. The average NOPAT margin of the past 5 years is 4%, and HAV is expected to have around NOK 700 million in sales in '23. That puts it at 10 times NOPAT. Nevertheless, everything points to the company being able to increase its sales to around NOK 1,000 million with minimal increase in fixed costs, which would mean NOPAT margins of around 8%, and we would be buying it at 4 times NOPAT.
HAV is a company with minimal fixed assets and an incremental ROCE of close to 100% (due to prepayments from customers). The sectors they serve have favorable tailwinds, and growth is expected to exceed 10% in the coming decades. In case this growth doesn't materialize, the company can reduce its capacity and increase its NOPAT margin to 5%-6%, safeguarding our investment at current multiples.
About the business
HAV has three lines of business:
HAV Design - Vessel design (support vessels for offshore platforms, offshore wind farms, ferries, fishing boats, etc.).
Norwegian Electric Systems - They design and implement electric propulsion systems for vessels.
Norwegian Greentech - They market water treatment systems, with two applications: (1) ballast water treatment systems for vessels and (2) water treatment systems for onshore aquaculture facilities. The main market is (1), where regulations require the installation of these systems on all ships since 2019.
In 2020, NGT had already installed these systems on 230 ships and had fleet agreements for at least as many more. These systems require international approval from organizations like the IMO (International Maritime Organization) and the US Coast Guard. This, along with the initial development cost, which has been around NOK 50 million for NGT, represents a barrier to entry for new competitors in a limited market.
Market (2) doesn't account for significant sales for NGT at the moment, but it's an expanding market in the future. NGT is collaborating with the company MMC First Process to develop products for the aquaculture market. MMC already has similar systems on the market, but they are based on electrochlorination, which produces potentially hazardous chemicals like hydrogen or chlorine. NGT's systems are based on the use of UV light, which doesn't have these issues, and they may capture a portion of the market. Other competitors are also developing UV-based systems.
HAV Hydrogen - They design hydrogen-based energy storage systems for marine propulsion. That’s it, no revenue yet, difficult to assess potential
HAV has shown unstable performance in terms of both revenue and profits over the past 5 years. During this time:
It has shifted its business focus from offshore oil and gas design to offshore wind energy.
It has expanded its electric propulsion business, tripling sales to external customers.
It has grown its ballast water treatment business from scratch to represent 30% of sales.
Risks
There might be low demand for the company's products and services due to changes or delays in environmental policies, aggressive competition, or unfavorable economic conditions.
When it comes to environmental policies, it seems that everything is on track, and the pressure to increase the use of low-emission technology will only grow. The company is tiny in a potentially much larger market. Policies may change in the future.
The management has historically shown good performance, but we need to see how they perform as a separate entity from the parent company.
While the company has seen overall significant growth, individual sectors have been somewhat volatile in recent years. We'll see if any of them stagnate or incur losses over the coming months/years.
The Market
Offshore Supply Vessel (O&G)
This has been HDS's primary market until '17, where a significant decline is noticeable since peak production in '13. Let's compare this with the revenues of one of the world's largest OSV operators for O&G, Tidewater (NYSE: TDW):

The high investment in offshore projects, supported by high oil barrel prices (above $100 since '11), resulted in high demand for service vessels for offshore oil platforms. Daily rates reached peaks of $18,000 in '15.
Then oil prices dropped to as low as $32 per barrel, and offshore projects were canceled. Tidewater's daily rates hit a low of $9,500 in '19. This, coupled with the low fleet utilization, caused TDW's revenues to drop by 80% from their highs. This situation persisted during the pandemic, with oil prices below $50 - $60 making offshore projects unfeasible.
However, it seems that this is starting to change. Since the Ukraine conflict, Brent crude oil prices have exceeded $100 again, offshore projects are being reactivated, and exploration activities are returning.
What's the outcome?
Fleet utilization is rising, and TDW's daily rates have increased by 32% YoY in Q3 '22, surpassing $13,000 (values not seen since '16).

What Comes Next
Times have been tought during the last years for operators and builders of OSV for O&G. Companies like TDW have been losing money for 8 years, which typically goes hand in hand with an increase in scrapping of old vessels and fleets.
TDW's fleet has an average age of 12.2 years, compared to 5.7 years in '12.
In the futures market, Brent is trading at around $70 in '26, and offshore production costs are estimated to have fallen to $43 per barrel.
If Brent oil prices continue as they are, it's highly likely that we'll see new investment in offshore platforms. In fact, investment in the North Sea is already taking place, and Norway accounts for 26% of global investment (Tidewater Q1 '23).

This, combined with an aging fleet, will likely lead to another cycle of high demand for OSVs and high investment, this would definitely benefit HDS. I don’t know if the company could reach again ‘14 sales in this segment, but it is a upside from the null sales now.
Here are some examples of fleet ages:
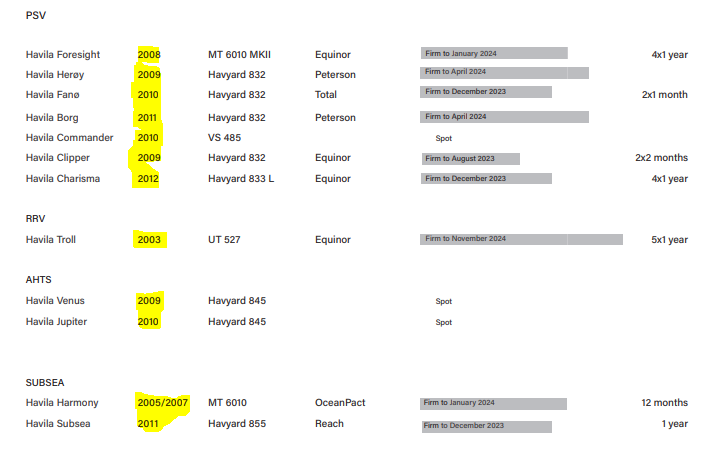
Havila Shipping - They don't have any vessels built after '12.
Tidewater -The world's largest PSV operator has an average fleet age of a little over 11 years. This is quite low compared to the global fleet's average of 19 years.

Offshore Supply Vessel (Wind)
Since 2020, HAV has begun designing Offshore Supply Vessels (OSVs) for the offshore wind energy sector, largely due to the lack of projects in the Oil & Gas (O&G) sector. What opportunities do we have in this sector?
Let's take a look at the U.S. Department of Energy's 2022 study, which presents the following market projections.
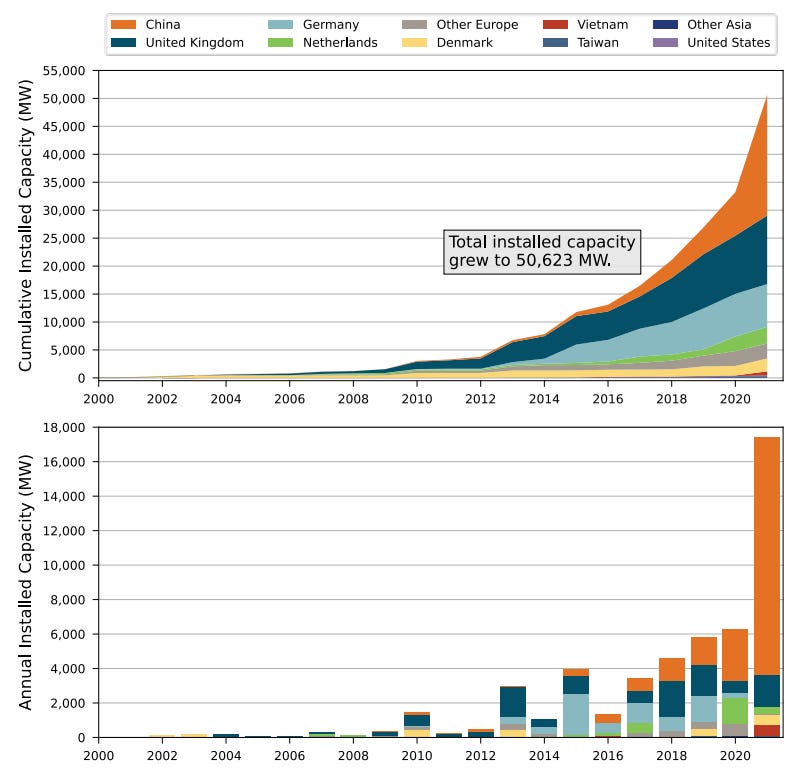
Global offshore wind energy deployment is forecast by 4C Offshore and BloombergNEF to increase globally to about 260 GW or more by 2030 (4C Offshore [2022]; BloombergNEF [2021]) and the number of countries currently generating from offshore wind is expected to double over the next decade (Ferris 2022).
Europe is expected to hold 45%–50% of the total installed global offshore wind capacity by 2031.
The estimated levelized cost of energy (LCOE) for fixed-bottom projects commissioned in 2021 has declined to $84 per megawatt-hour (MWh) on average, with a range of $61/MWh to $116/MWh globally. Industry experts estimate that the levelized cost of energy will average $60/MWh by 2030.
Other studies show a similar perspective, such as the one conducted by DNV, an energy and maritime transport consultancy.
In Europe, 50% of electricity will come from wind
From today to 2050, wind capacity will grow 9-fold, onshore wind 7-fold, and offshore wind 56-fold. LCOE for fixed and floating offshore wind reduces 39% and 84%, respectively, in their forecast period. Even relatively mature onshore wind sees cost reductions of 52%. These developments fuel the rise of on-grid wind from 1,600 TWh/yr in 2020 to 19,000 TWh/yr in 2050. By 2050, wind will provide almost 50% of on-grid electricity in Europe, and 40% in North America and Latin America.
Grid electricity from wind increases from 1.6 PWh/yr in 2020 to 19 PWh/yr in 2050, with Greater China, Europe, and North America leading in output, and OECD and Latin America growing sharply from 2030. Europe and OECD Pacific will have the highest shares of offshore wind.
They predict a 56-fold increase in installed offshore wind capacity by 2050, a remarkable growth.
We have a potential market that will multiply by 5 times by 2030, with Europe holding a 50% share and construction projects accounting for 50% of the existing capacity.
Other companies in the sector also predict similar growth, as is the case with Nekkar, which manufactures cranes for use in ports and on ships.

Edda Wind, an operator of Service Operation Vessels (SOVs) for the offshore wind energy sector.

Land-based Aquaculture
The land-based aquaculture market is much more promising than the marine sector. This QYresearch study predicts a nearly 15% annual growth until 2029, both in the United States and Europe. This could heavily benefid NGT, as they are in process of adapting their ballast water treatment systems for land based aquaculture.
Decarbonization of the Maritime Sector
If global shipping were a country, it would be the sixth largest producer of greenhouse gas emissions.
International Maritime Organization
The maritime sector emits 3% of all greenhouse gases, and large transport vessels use dirtier fuels than other modes of transport, leading to higher emissions of harmful compounds for human health.
In 2018, the IMO (International Maritime Organization, a branch of the United Nations) published its decarbonization goals for the maritime industry:
With 2008 as a baseline year, this strategy aims to reduce with at least 50% total greenhouse gas (GHG) emissions from shipping by 2050, while at the same time reducing the average carbon intensity (CO2 per tonne-mile) by at least 40% by 2030, and 70% before mid-century.
Step 1: The EEDI and EEXI Indices
The Energy Efficiency Design Index (EEDI) represents a key component of the IMO’s regulations to lower the carbon intensity of the world fleet. The EEDI, which applies to most newbuildings, requires that the amount of CO2 emitted by a vessel (in grams) per tonne-mile of work be set using a formula based on the technical design parameters for a given ship.
The IMO does not specify how vessels are to meet EEDI targets. So long as the required energy efficiency level is attained, ship designers and shipyards are free to explore any technology or design solution that meets compliance.
Typical efficiency measures include the following:
Propulsion optimization (e.g., ducted propellers)
Engine optimization (e.g., hybrids)
Energy-efficient technologies
Engine power limitation
The Energy Efficiency Existing Ship Index (EEXI) applies many of the same design requirements as the EEDI, with some adaptations regarding limited access to design data. The intention of the EEXI regulation is to bring existing vessels to a similar efficiency standard as more modern ones. The EEXI will come into force in 2023.
All new ships must implement measures to reduce their emissions below the EEDI index. Starting in 2023, existing ships must also comply with the EEXI index, and if they don't meet it, they must implement measures to achieve compliance.
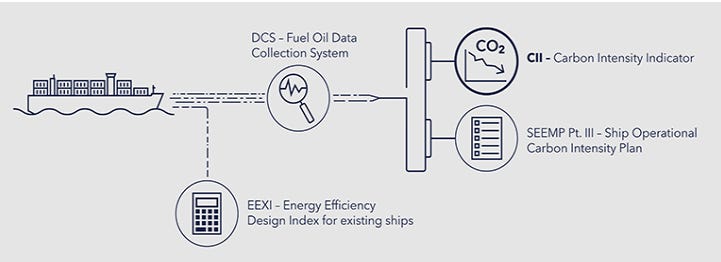
Step 2. CII - Carbon Intensity Indicator
The CII index will measure how efficient ships over 5000 tons are in terms of grams of CO2 emitted in relation to their capacity and distance traveled. This index will range from A (best) to E (worst).

All these ships will have to report their CII before March 31, 2024. Ships with three consecutive years of a D index, or one year of E, will have to implement a corrective action plan.
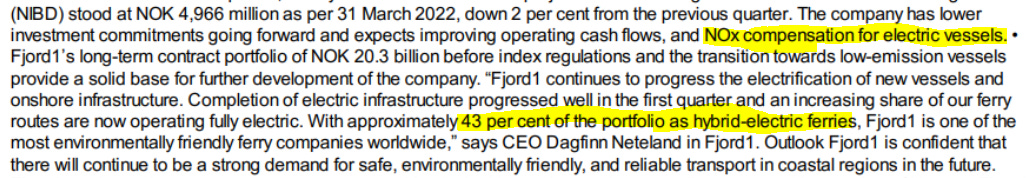
I have seen this trend in several companies in the sector. For example, Fjørd, a ferry operator in Norway, mentions their interest in NOx compensation credits provided to companies operating electric ships, as well as the progress in electrifying their fleet. Fjørd is a client of HDS and NES.
Underutilization of Capacity
HAV has been hiring for the past 3 years. They've gone from 99 employees in '19 to 147 in '22. According to the management, they are underutilizing their capacity, which they don't reduce in anticipation of higher demand in the coming years. If this is the case, we need to consider two things:
1 - To what level of sales can the company expand with the current employees?
2 - What margin can we expect in that normalized scenario?
In the IPO document published by HAV at the end of 2020, the management gives us an estimate of capacity utilization for 2021 based on the backlog at that time. They estimated a 50% utilization for NES and a 75% utilization for HDS. Using the sales of 2021, we would have a maximum capacity of NOK 1458M. Let's adjust this data a bit because it was a year with higher equipment sales than in a normalized scenario, and we find a maximum capacity of NOK 1100 - 1300M.
Since 2021, HAV has opened new offices in Turkey and hired some more staff, so the actual capacity should be higher. Without taking this into account, NES + HDS should generate EBITDA margins above 10% if they achieve sales of NOK 800M, providing NOK 90M in EBITDA. The estimates we are using are quite reasonable:
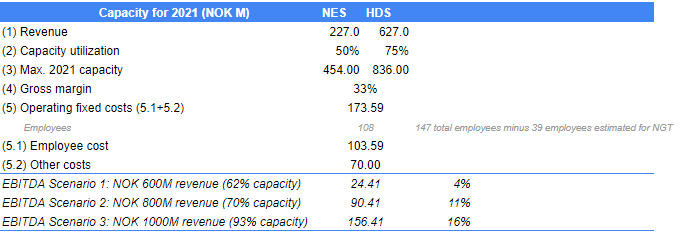
The gross margin of 33% is the lowest in the last 3 years, which HAV achieved in 2021, a year with a high share of equipment sales with lower margins than design.
The sales range we consider achievable with the current staff capacity aligns with the management's guidance of NOK 1.3B in 2025.
In 2021, with sales of NOK 916M (including NGT), HAV achieved an EBITDA margin of 12%.
If HAV increases its total sales above NOK 1B, we would have NOK 117M in EBITDA. Subtracting about NOK 15M in CAPEX (R&D), a 25% tax rate, we would have a NOPAT of NOK 76M.
Working capital
Engineering and system integration companies are generally light in capital; their most important assets are typically working capital (work done for clients not yet paid) and intangibles (R&D, patents, etc.). In the case of HAV, there's a situation that is different from many other system integrators: they have a significant portion (40%-50%) of prepaid orders in their backlog.
This means two things:
1 - HAV receives a large amount of money when they sign an order, which they don't pay to suppliers until some time later, so they could grow with very little or no additional capital requirement.
2 - Of the NOK 224 in cash they have, they could use NOK 80-100M for conservative share buybacks or acquisitions without affecting the company's ability to finance its working capital. In fact, the difference between current assets and current liabilities is NOK 82M, which can be counted as unnecessary cash for the business when calculating the EV.

This situation has not always been the case. Until 2020, HAV had a much higher accounts receivable level, which dropped suddenly in 2021. It's not a coincidence, as this is when the company separated from its parent company Havyard, which was until then its main customer (and a debt-laden shipyard that needed financing).
The internal contracts, where NES acts as a supplier to the affiliated Havyard Group, have an aggregate contract price of approximately NOK 350 million, varying from approximately NOK 12 million to NOK 60 million depending on the extent and deliverables provided by each contract. The internal contracts provide for deliveries throughout 2022. On the basis of the current contract portfolio, NES expects to have its capacity approximately 50% covered for 2021. On the basis of the current contract portfolio, HDS expects to have its capacity approximately 75% covered for 2021.
-HAV Group ‘21 results
Management
Management of HAV group has plenty os experience in the naval industry, with CEO Gunnar Larsen having 34 years of experience, 13 of those with Havyard. A good chunk of the management went with HAV after the spinoff from Havyard, which is usually a good signal. The company’s main shareholder is the Saevik family, which through Havila Holdings owns about 25% of the company.
Management is deploying some of the available cash to buy back stock, repurchasing 10% of the company stock over the past year. Some insiders are also purchasing stock, either via a employee purchasing program or on the open market.
Valuation
HAV has a EV of about NOK 250M and the company is usually profitable at around the NOK 650M revenue level (similar to LTM) with a net margin of 4%-5%. That makes up to NOK 25-32M and a valuation of aproximately 10x net profit. I believe this revenue level is low, considering market proyections and recent tender activity, if sales go up to NOK 900M a year and the company can increase hedacount utilization, company would be trading at 3x-5x net profit.
HAV group is in process of being awarded its bigger contract ever, 4 electric ferrys for Fjord1. This contract includes full design and system integration and based on previous ferries developed by the company, it could be worth around NOK 500M. In july of this year they signed a NOK 200M contract for a SOV.
Accounting for this 2 contracts, the order intake of ‘23 is already over NOK 990M, which I believe puts the NOK 70M earnings level at clear sight.
And that’s it for today! Let me know if you liked the post or you have any questions about the company. As always, my inbox is open. Also subscribe to the newsletter if you wish to be updated on this an other companies I will be reviewing in the future.
Bye.
Dani
Operational leverage for the upside is one of my favourite investment strategies. You just need to discover the change in a trend before the others do.